Multiple Choice
Use the REGRESSION feature on a graphing calculator:
-Since 1984 funeral directors have been regulated by the Federal Trade Commission. The average cost of a funeral for an adult in a Midwest city has increased, as shown in the following table. 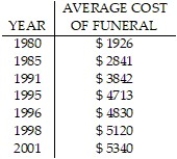 Let x represent the number of years since 1980. Use a graphing calculator to fit a quartic function to the data. Round your answer to five decimal places.
A) y = 170.5971x + 1991.5213
B) 
C) 
D) 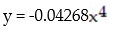
Correct Answer:

Verified
Correct Answer:
Verified
Q32: The graph that follows is the graph
Q33: Find the equations of any vertical asymptotes:<br>-<img
Q34: The graph that follows is the graph
Q35: Graph the function using a calculator and
Q36: Solve the equation graphically to four decimal
Q38: Sketch the graph of the function:<br>-f(x) =
Q39: Find the x-intercept(s) if they exist:<br>-<img src="https://d2lvgg3v3hfg70.cloudfront.net/TB10044/.jpg"
Q40: Write in terms of simpler forms:<br>-<img src="https://d2lvgg3v3hfg70.cloudfront.net/TB10044/.jpg"
Q41: Since life expectancy has increased in the
Q42: Determine if the equation specifies a function