Multiple Choice
Construct a bar graph of the given frequency distribution:
-The frequency distribution indicates the height in feet of persons in a group of 216 people. 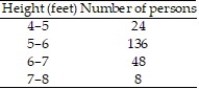

A) 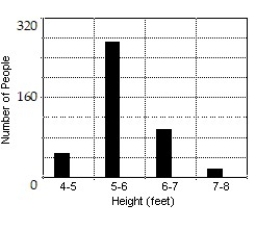
B) 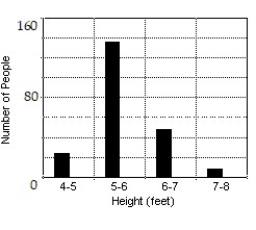
C) 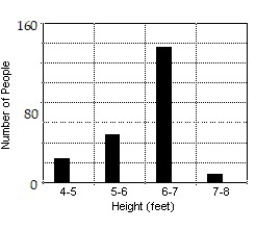
D) 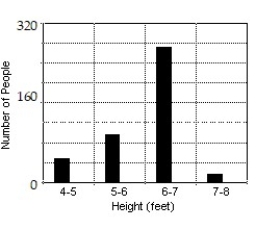
Correct Answer:

Verified
Correct Answer:
Verified
Related Questions
Q50: Find the median for the data set:<br>2,
Q51: Find the mean for the following grouped
Q52: Construct the specified histogram:<br>-Twenty voters were asked
Q53: The register of a college recorded the
Q54: In the English department of a midwestern
Q56: Construct the specified histogram:<br>-Construct a histogram for
Q57: Construct a histogram for the binomial distribution
Q58: Find the median for the following grouped
Q59: Here are the prices for 8 different
Q60: A normal random variable X has mean