Short Answer
Construct a broken-line graph of the data in the table:
-The following table shows the number of computer sales made at Computer Buy over five months. Use time on the horizontal scale for your line graph. 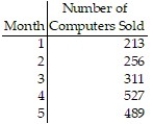
Correct Answer:

Verified
Correct Answer:
Verified
Related Questions
Q8: Given a normal distribution with mean 120
Q9: Find the mean for the data set:<br>2,
Q10: Find the median for the following grouped
Q11: Find the standard deviation for the following
Q12: What proportion of the following sample of
Q14: Use the rule-of-thumb test to check whether
Q15: Here are the prices for 8 different
Q16: Given a normal distribution with mean 120
Q17: Following is a sample of the percent
Q18: A normal distribution has mean 200 and