Multiple Choice
The test scores of 40 driver license applicants are summarized in the frequency table below. Find the standard deviation. 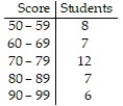 Round your answer to one decimal place.
A) 12.0
B) 12.1
C) 12.7
D) 14.1
E) 13.4
Correct Answer:

Verified
Correct Answer:
Verified
Q15: Here are the prices for 8 different
Q16: Given a normal distribution with mean 120
Q17: Following is a sample of the percent
Q18: A normal distribution has mean 200 and
Q19: Construct the specified histogram:<br>-Construct a histogram for
Q21: Construct a frequency polygon:<br>-<img src="https://d2lvgg3v3hfg70.cloudfront.net/TB10044/.jpg" alt="Construct a
Q22: Following is a sample of the percent
Q23: The frequency distribution below gives the weight
Q24: If a baseball player has a batting
Q25: Given a normal distribution with mean 120