Multiple Choice
Use the REGRESSION feature on a graphing calculator:
-The paired data below consists of the temperature on randomly chosen days and the amount of a certain kind of plant grew (in millimeters) .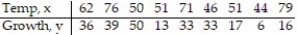
Find the linear function that predicts a plant's growth as a function of the temperature. Round your answer to two decimal places.
A) 
B) y = 14..57x + 0.21
C) y = 0.21x + 14.57
D) 
Correct Answer:

Verified
Correct Answer:
Verified
Q42: Write the equation of a line that
Q43: Write the equation of the line in
Q44: Determine whether the slope of the line
Q45: Solve the inequality and graph. Express
Q46: Solve the formula for the specified
Q48: Solve the formula for the specified variable:<br>-<img
Q49: Given two points ( <img src="https://d2lvgg3v3hfg70.cloudfront.net/TB10044/.jpg" alt="Given
Q50: Find the slope and y intercept of
Q51: Find the slope and y intercept of
Q52: Find the slope of the line containing