Multiple Choice
Use the REGRESSION feature on a graphing calculator:
-The use of bottled water in the United States has shown a steady increase in recent years. The table shows the annual per capita consumption for the years 1995 - 2001.
With x being the years since 1995, find the linear function that represents this data. Round your answer to two decimal places.
A) y = 0.89x + 4.07
B) 
C) y = 4.07x + 0.89
D) 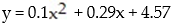
Correct Answer:

Verified
Correct Answer:
Verified
Q6: Use the graph to find the slope,
Q7: Determine whether the slope of the line
Q8: Solve the inequality and graph. Express
Q9: Solve the problem. Express your answer as
Q10: Graph the linear equation and determine its
Q12: Solve: <img src="https://d2lvgg3v3hfg70.cloudfront.net/TB10044/.jpg" alt="Solve: A)
Q13: Solve the problem. Express your answer as
Q14: Find the slope and y intercept of
Q15: Graph the linear function defined by f(x)
Q16: Solve the problem. Express your answer as