Multiple Choice
Use the REGRESSION feature on a graphing calculator:
-A study was conducted to compare the average time spent in the lab each week versus course grade for computer students. The results are recorded in the table below.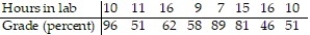
Use linear regression to find a linear function that predicts a student's course grade as a function of the number of hours spent in lab.
A) y = 0.930 + 44.3x
B) y = 44.3 + 0.930x
C) y = 88.6 - 1.86x
D) y = 1.86 + 88.6x
Correct Answer:

Verified
Correct Answer:
Verified
Q49: Given two points ( <img src="https://d2lvgg3v3hfg70.cloudfront.net/TB10044/.jpg" alt="Given
Q50: Find the slope and y intercept of
Q51: Find the slope and y intercept of
Q52: Find the slope of the line containing
Q53: A small company that makes hand-sewn leather
Q54: Find the slope and y intercept of
Q56: Solve the problem. Express your answer as
Q57: Assume that the price per unit d
Q58: Solve the problem. Express your answer as
Q59: Graph the equation:<br>-42 + 6y = 0<br><img