Multiple Choice
Use the REGRESSION feature on a graphing calculator:
-In the table below, x represents the number of years since 2000 and y represents sales (in thousands of dollars) of a clothing company. Use the regression equation to estimate sales in the year 2006. Round to the nearest thousand dollars.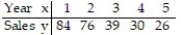
A) $8,000
B) $20,000
C) $14,000
D) $2,000
Correct Answer:

Verified
Correct Answer:
Verified
Q21: Write an equation of the line with
Q22: Use the graph to find the slope-intercept
Q23: Solve the formula for the specified variable:<br>-Solve:
Q24: Write the equation of a line that
Q25: Write an equation of the line with
Q27: A piece of equipment was purchased by
Q28: Write an equation of the line with
Q29: Write an equation of the line with
Q30: Use the REGRESSION feature on a graphing
Q31: Write an equation of the line with