Multiple Choice
The following graph shows the titration of a 0.150 M benzoic acid solution. At what pH range would benzoic acid be appropriate to make a buffer? 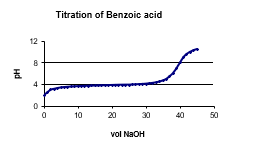
A) 2.2
B) 3.5
C) 4.0
D) 7.5
E) 10.0
Correct Answer:

Verified
Correct Answer:
Verified
Related Questions
Q13: When 0.1 moles of HCl are added
Q14: When 0.1 moles of HC<sub>2</sub>H<sub>3</sub>O<sub>2</sub> and 0.1
Q15: What is the concentration of phosphate in
Q16: A buffer solution made from ammonia, NH<sub>3</sub>,
Q17: In the selective precipitation of metal ions
Q19: Write the equilibrium constant expression and determine
Q20: What is the concentration of [PbCl<sub>3</sub>]<sup>-
Q21: The equivalence point for titration of 50
Q22: Calculate the concentrations of species involved in
Q23: Write the equilibrium constant expression and determine