Multiple Choice
Review the following graph. What is the incidence of varicella (chickenpox) trend from 1990 to 2014 in these four states?
Varicella incidence per 100,000 population in states that have reported varicella cases to CDC annually since before implementation of the varicella vaccination program - Illinois, Michigan, Texas, and West Virginia, 1990-2014.
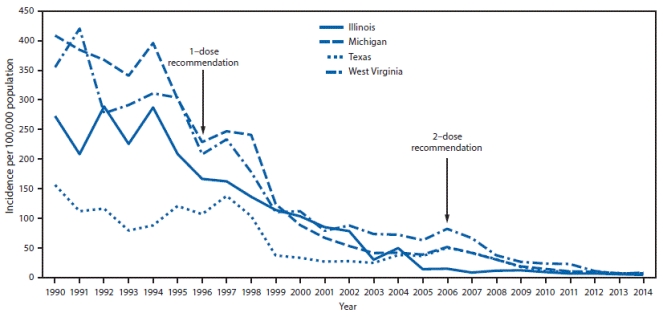 Source: Lopez AS, Zhang J, Marin M. Epidemiology of Varicella During the 2-Dose Varicella Vaccination Program - United States, 2005-2014. MMWR Morb Mortal Wkly Rep 2016; 65:902-905. DOI: http://dx.doi.org/10.15585/mmwr.mm6534a4.
A) downward
B) upward
C) flat
D) mixed
Correct Answer:

Verified
Correct Answer:
Verified
Q30: What type of research uses both quantitative
Q31: Use the data below to calculate the
Q32: Which data presentation tool best displays the
Q33: What type of research collects numerical data?<br>A)
Q34: The _ graph is an illustration of
Q35: Which process populates the patient database used
Q37: Use the data below to calculate the
Q38: The blood pressure of patients discharged in
Q39: _ is how many new cases of
Q40: Use the data below to calculate the