Short Answer
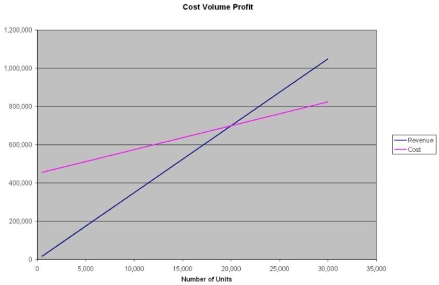
Sam manufactures a product that is selling so well, he has decided to expand his operation to 50,000 units per month. The unit cost is $7, estimated fixed costs are $1.8 mil per year and variable costs are $5 per unit. The product currently sells for $20. Use the graphical approach to CVP analysis to solve the following:
a) What is the break-even point as a percent of capacity?
b) What would the net income be at 75% capacity?
c) What would unit sales have to be to attain a net income of $100,000?
d) If sales dropped to 50% of capacity, what would the resulting net income be?
Correct Answer:

Verified
a) approx 37.5%
b) a...View Answer
Unlock this answer now
Get Access to more Verified Answers free of charge
Correct Answer:
Verified
b) a...
View Answer
Unlock this answer now
Get Access to more Verified Answers free of charge
Q70: Go to the textbook's OLC (www.mcgrawhill.ca/olc/jerome/) and
Q71: Determine the slope and y-intercept of each
Q72: Solve the following problem using the Contribution
Q73: Dynacan Ltd. manufactured 10,000 units of product
Q74: Kuldip's factory manufactures toys that sell for
Q76: Use the graphical method to solve the
Q77: Use the Interactive break-even Chart and its
Q78: This problem is designed to illustrate how
Q79: Solve the following problem using the Contribution
Q80: Clone Computers assembles and packages personal computer