Short Answer
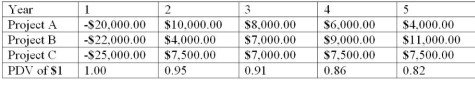
The Table below shows net cash flows for 3 mutually exclusive projects from which a company can choose. Each project requires an investment in the first year, then produces a positive net cash flow for each of the following four years. Assuming an interest rate of 5%, which project would the company choose?
Does the best project have the highest total net cash flow?
The shortest payback period?
Correct Answer:

Verified
The NPV of each project is calculated in...View Answer
Unlock this answer now
Get Access to more Verified Answers free of charge
Correct Answer:
Verified
View Answer
Unlock this answer now
Get Access to more Verified Answers free of charge
Q2: Suppose you borrow $1,000 at 8% for
Q3: <img src="https://d2lvgg3v3hfg70.cloudfront.net/TB10233/.jpg" alt=" -Refer to Scenario
Q4: If a bank is lending money at
Q5: Suppose the interest rate is 6% and
Q6: <img src="https://d2lvgg3v3hfg70.cloudfront.net/TB10233/.jpg" alt=" -Refer to Scenario
Q7: Suppose you make a $5,000 investment that
Q8: <img src="https://d2lvgg3v3hfg70.cloudfront.net/TB10233/.jpg" alt=" -Refer to Figure
Q9: Assume the interest rate is 5%. What
Q11: Suppose you lend $2,500 at 11.5% for
Q12: If the real interest rate is 7.5%