Multiple Choice
If gun control legislation were passed to reduce the number of homicides,which of the following graphs would be most likely to convince you that the legislation was producing the intended effect? Note that in all graphs the horizontal axis (x axis) is time,the vertical axis (y axis) is number of homicides,and the (*) indicates an observation.
A) 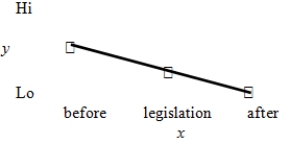
B) 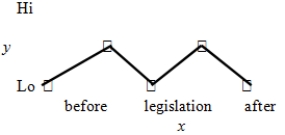
C) 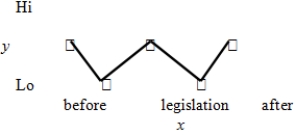
D) 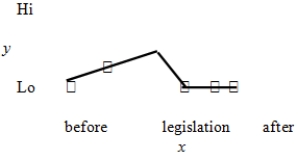
E) All of these choices indicate that the legislation is having the intended effect.
Correct Answer:

Verified
Correct Answer:
Verified
Q31: What is meant by social indicators research?
Q32: The denominator in a per capita rate
Q77: Hortense was asked by the local recreation
Q78: Which of the following is(are)FALSE regarding time-series
Q79: Evaluations often occur within the context of
Q81: What are the different types of evaluation
Q83: What differentiates quasi-experimental designs from true experimental
Q84: Frank is conducting a program evaluation of
Q86: Cost/benefit analysis is an easy way to
Q87: Walter is conducting a study to determine