Multiple Choice
The graph shown below is the graph of which function?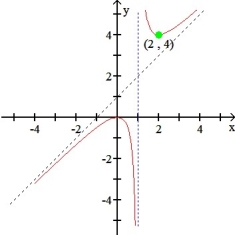
A) 
B) 
C) 
D) 
E) 
Correct Answer:

Verified
Correct Answer:
Verified
Related Questions
Q31: Find the local extrema and inflection points
Q32: Find any extreme values of the function
Q33: Find the extreme values of f(x)
Q34: Find any extreme values of the function
Q35: Water is leaking out of an inverted
Q37: There are 50 apple trees in an
Q38: Use Newton's Method to find the roots
Q39: The power P (watts) in an electric
Q40: Find the minimum values of the function
Q41: Use information from the function and its