Multiple Choice
The graph shown in the figure below is the graph of which function?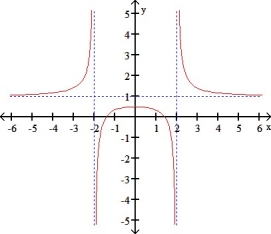
A) y = 
B) y = 
C) y = 
D) y = 
E) y = 
Correct Answer:

Verified
Correct Answer:
Verified
Related Questions
Q46: The function f(x) = 3x<sup>5</sup> + Ax<sup>4</sup>
Q47: The graph of f(x) = 3 <img
Q48: Evaluate the limit . <img src="https://d2lvgg3v3hfg70.cloudfront.net/TB9661/.jpg"
Q49: Use information from the function and its
Q50: Find the roots of the equation x<sup>3</sup>
Q52: A poster has an area of 800
Q53: At a certain instant the length of
Q54: Determine the concavity of f(x) = cos
Q55: Find the ratio of the height h
Q56: A balloon is 100 metres off the