Multiple Choice
In the following figure the curve is the graph of a quantity y that is a function of time t. Also shown is its tangent line at t = 100. What is the average rate of change of y from t = 20 to t = 160? What is the approximate rate of change of y with respect to t at t = 100? 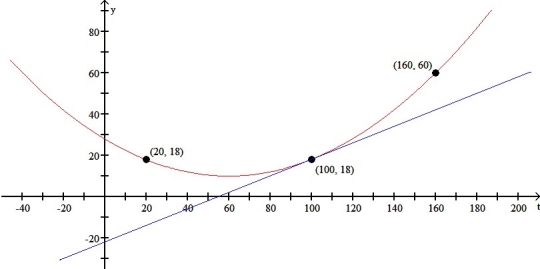
A)  ,
, 
B)  ,
, 
C)  ,
, 
D)  ,
, 
E) none of the above
Correct Answer:

Verified
Correct Answer:
Verified
Q1: Courier rates for delivery of mail up
Q3: Evaluate . <img src="https://d2lvgg3v3hfg70.cloudfront.net/TB9661/.jpg" alt=" Evaluate
Q4: Let f(x) = <img src="https://d2lvgg3v3hfg70.cloudfront.net/TB9661/.jpg" alt="Let f(x)
Q5: If h(x) = <img src="https://d2lvgg3v3hfg70.cloudfront.net/TB9661/.jpg" alt="
Q6: Let f(x) be defined by f(x) =
Q7: Evaluate . <img src="https://d2lvgg3v3hfg70.cloudfront.net/TB9661/.jpg" alt=" Evaluate
Q8: Let f(x) = <img src="https://d2lvgg3v3hfg70.cloudfront.net/TB9661/.jpg" alt="Let f(x)
Q9: Evaluate . <img src="https://d2lvgg3v3hfg70.cloudfront.net/TB9661/.jpg" alt=" Evaluate
Q10: For what values of the constants c
Q11: Evaluate the following limit: <img src="https://d2lvgg3v3hfg70.cloudfront.net/TB9661/.jpg" alt="Evaluate