Multiple Choice
Use the information contained in this chart to determine your answer. Twenty samples of size 8 were taken from a stable process. From past studies of the process, you know that the overall mean is 42.5 and that the average of the samples range is 2.0.
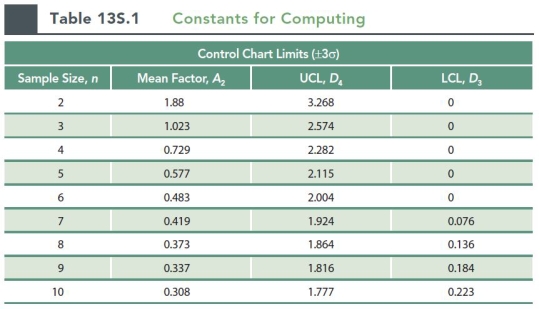
-The LCL for the three sigma X bar chart for the process is approximately (for a sample size of 8, A2 = 0.373) :
A) 42.95
B) 43.25
C) 43.46
D) 42.50
E) 41.75
Correct Answer:

Verified
Correct Answer:
Verified
Q62: Number of defects = 1,201; opportunities for
Q63: Forty samples of 100 are taken, with
Q64: Over a 10-day period, an outdoor light
Q65: Romeo and Juliet make and sell cookies
Q66: Forty samples of 100 are taken,
Q68: Forty samples of 100 are taken, with
Q69: A product has 6 parts, the company
Q70: A company currently produced 750,000 units, with
Q71: Romeo and Juliet make and sell cookies
Q72: An airline wants to monitor the performance