Multiple Choice
A company has the information shown in the chart below regarding its forecast performance in the past three periods.
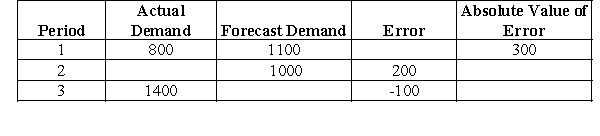
-Calculate the mean absolute deviation (MAD) .
A) -66.67
B) 225.00
C) 200.00
D) 1,200.00
E) Need more information to answer the question
Correct Answer:

Verified
Correct Answer:
Verified
Q11: A company has the data shown in
Q12: A company has the data shown in
Q13: A well-educated lumberjack decides to use linear
Q14: A company has the data shown in
Q15: <img src="https://d2lvgg3v3hfg70.cloudfront.net/TBR4941/.jpg" alt=" -For Plutonium Courtyard
Q17: Given the series of demand data below<br>
Q18: Given the series of demand data below<br>
Q19: <img src="https://d2lvgg3v3hfg70.cloudfront.net/TBR4941/.jpg" alt=" -Willow Company had
Q20: Humboldt Corporation is preparing an aggregate production
Q21: A company has the data shown in