True/False
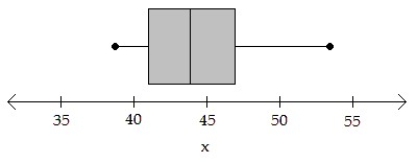
A simple random sample of size n < 30 for a quantitative variable has been obtained. Using the normal probability plot, the correlation between the variable and expected z-score, and the boxplot, judge whether a t-interval should be constructed.
-n = 10; Correlation = 0.896 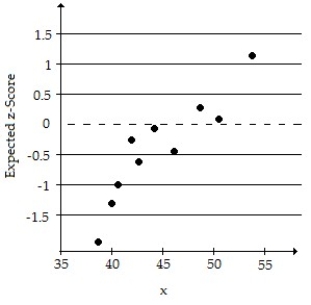
Correct Answer:

Verified
Correct Answer:
Verified
Q2: A random sample of 20 electricians is
Q3: In a random sample of 26 laptop
Q4: Determine the critical value <img src="https://d2lvgg3v3hfg70.cloudfront.net/TB10223/.jpg" alt="Determine
Q5: The general form of a large-sample (1
Q6: Find the t-value.<br>-Let <img src="https://d2lvgg3v3hfg70.cloudfront.net/TB10223/.jpg" alt="Find the
Q8: Determine the point estimate of the population
Q9: What is the best point estimate for
Q10: Find the t-value.<br>-Find the t-value such that
Q11: In a random sample of 60 dog
Q12: A confidence interval for p can be