Essay
You are performing a study about the weight of preschoolers. A previous study found the weights to be normally distributed with a mean of 30 and a standard deviation of 4. You randomly sample 30 preschool children and find their weights to be as follows. 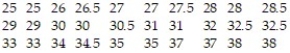 a) Draw a histogram to display the data. Is it reasonable to assume that the weights are normallydistributed? Why?
b) Find the mean and standard deviation of your sample.
c) Is there a high probability that the mean and standard deviation of your sample are consistentwith those found in previous studies? Explain your reasoning.
Correct Answer:

Verified
(a)  It is not reasonable to a...
View Answer
Unlock this answer now
Get Access to more Verified Answers free of charge
Correct Answer:
Verified
View Answer
Unlock this answer now
Get Access to more Verified Answers free of charge
Q9: The amount of soda a dispensing machine
Q10: Determine the area under the standard normal
Q11: Find the indicated z-score.<br>-Determine the two z-scores
Q12: Compare a graph of the normal density
Q13: Find the indicated z-score.<br>-Find the z-score for
Q15: Find the indicated probability.<br>-Assume that the random
Q16: Find the indicated z-score.<br>-Find the z-score for
Q17: Find the indicated z-score.<br>-Find the z-score for
Q18: Find the indicated z-score.<br>-Find the z-scores for
Q19: A brewery has a beer dispensing machine