Essay
Construct a scatter diagram for the data.
-The data below are the number of absences and the final grades of 9 randomly selected students from a literature class. 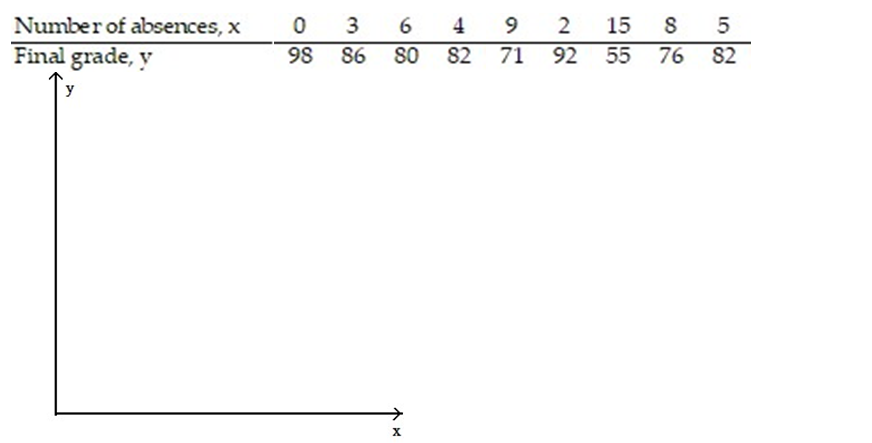
Correct Answer:

Verified
Correct Answer:
Verified
Related Questions
Q72: Each year a nationally recognized publication conducts
Q73: In a study of feeding behavior, zoologists
Q74: Each year a nationally recognized publication conducts
Q75: Analyze the residual lot below. Does it
Q76: The data below are the average one-way
Q78: Calculate the linear correlation coefficient for the
Q79: A manufacturer of boiler drums wants to
Q80: Civil engineers often use the straight-line equation,
Q81: A manager wishes to determine the relationship
Q82: The coefficient of correlation between x and