Essay
Construct a scatter diagram for the data.
-Five brands of cigarettes were tested for the amounts of tar and nicotine they contained. All measurements are in milligrams per cigarette. 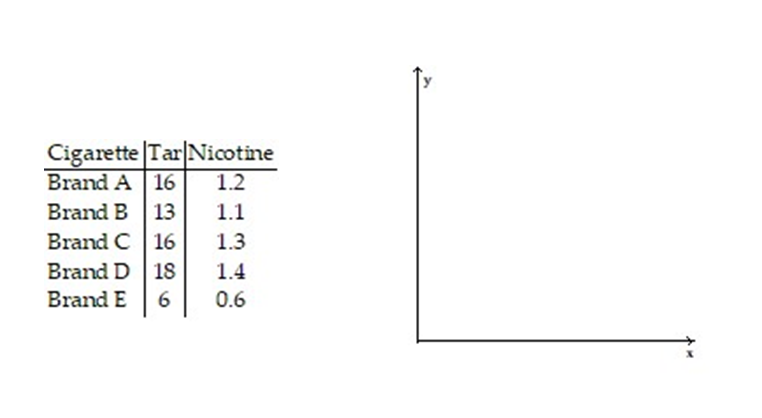
Correct Answer:

Verified
Correct Answer:
Verified
Related Questions
Q82: The coefficient of correlation between x and
Q83: Civil engineers often use the straight-line equation,
Q84: The regression line for the given data
Q85: The following data represent the living situation
Q86: Use the linear correlation coefficient given to
Q88: In a study of feeding behavior, zoologists
Q89: The regression line for the given data
Q90: In an area of Russia, records were
Q91: A county real estate appraiser wants to
Q92: A scatter diagram is given with one