Multiple Choice
Make a scatter diagram for the data. Use the scatter diagram to describe how, if at all, the variables are related.
-
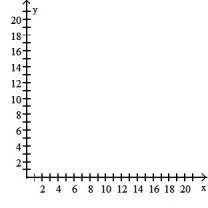
A) The variables appear to be negatively, linearly related. 
B) The variables appear to be positively, linearly related. 
C) The variables do not appear to be linearly related. 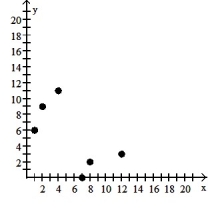
D) The variables do not appear to be linearly related. 
Correct Answer:

Verified
Correct Answer:
Verified
Q52: Compute the sum of the squared residuals
Q53: Construct a scatter diagram for the data.<br>-In
Q54: Construct a relative frequency marginal distribution for
Q55: The dean of the Business School at
Q56: A company keeps extensive records on its
Q58: Researchers conducted a study to determine which
Q59: A manager wishes to determine the relationship
Q60: The data below are the number of
Q61: Find the equation of the regression line
Q62: The regression line for the given data