Essay
The test scores of 30 students are listed below. Draw a boxplot that represents the data. 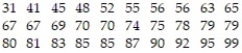
Correct Answer:

Verified
Correct Answer:
Verified
Related Questions
Q28: For the following data, approximate the mean
Q29: Each year advertisers spend billions of dollars
Q30: Calculate the mean, median, and mode for
Q31: A student scores 62 on a geography
Q32: Compute the range for the set of
Q34: If <img src="https://d2lvgg3v3hfg70.cloudfront.net/TB10223/.jpg" alt="If ,
Q35: A study was designed to investigate the
Q36: The commute times (in minutes) of 30
Q37: Health care issues are receiving much attention
Q38: The following data represent the bachelor degrees