Essay
The cholesterol levels (in milligrams per deciliter) of 30 adults are listed below. Draw a boxplot that represents the data. 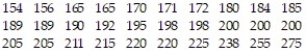
Correct Answer:

Verified
Correct Answer:
Verified
Related Questions
Q56: Compute the range for the set of
Q57: Compute the range for the set of
Q58: When results from a scholastic assessment test
Q59: Find the sample standard deviation.<br>-7, 5, 13,
Q60: The high temperatures (in degrees Celsius) each
Q61: On a recent day during the flu
Q62: The grades are given for a student
Q63: Find the sample standard deviation.<br>-5, 2, 18,
Q64: Many firms use on-the-job training to teach
Q66: Compute the range for the set of