Multiple Choice
SAS was used to compare the high school dropout rates for the 30 school districts in one city in 2010 and 2012. The box plots generated for these dropout rates are shown below.Compare the center of the distributions and the variation of the distributions for the two years. 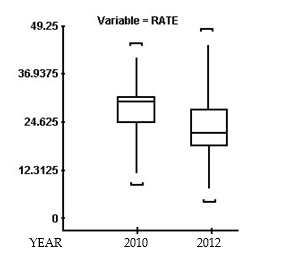
A) Dropout rates had a higher average with more variability in 2010 than in 2012.
B) Dropout rates had a higher average with less variability in 2010 than in 2012.
C) Dropout rates had a lower average with less variability in 2010 than in 2012.
D) Dropout rates had a lower average with more variability in 2010 than in 2012.
Correct Answer:

Verified
Correct Answer:
Verified
Q3: A study was designed to investigate the
Q4: Solar energy is considered by many to
Q5: The following data represent a random sample
Q6: A severe drought affected several western states
Q7: Find the sample standard deviation.<br>-24, 90, 25,
Q9: A 1-pound bag of peanuts contains 430
Q10: A study was designed to investigate the
Q11: Compute the range for the set of
Q12: Each year advertisers spend billions of dollars
Q13: Solar energy is considered by many to