Multiple Choice
We are interested in comparing the average supermarket prices of two leading colas in the Tampa area. Our sample was taken by randomly going to each of eight supermarkets and recording the price of a six-pack of cola of each brand. The data are shown in the following table. Find a 98% confidence interval for the difference in mean price of brand 1 and brand 2. Assume that the paired data came from a population that is normally distributed. 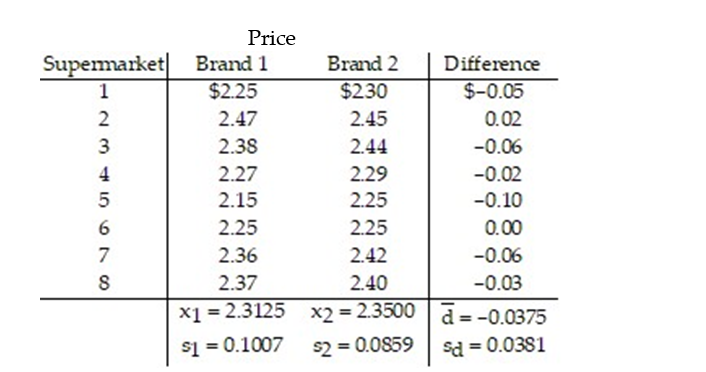
A) (-0.0722, -0.0028)
B) (-0.1768, 0.1018)
C) (-0.0846, 0.0096)
D) (-0.0779, 0.0029)
Correct Answer:

Verified
Correct Answer:
Verified
Q44: Data sets A and B are dependent.
Q45: Test the hypothesis that <img src="https://d2lvgg3v3hfg70.cloudfront.net/TB10223/.jpg" alt="Test
Q46: Find the test statistic to test the
Q47: Find the test statistic, z, to test
Q48: A well-known study of 22,000 male physicians
Q50: Construct a 95% confidence interval for data
Q51: Find the test statistic, t, to test
Q52: Data sets A and B are dependent.
Q53: Test the hypothesis that <img src="https://d2lvgg3v3hfg70.cloudfront.net/TB10223/.jpg" alt="Test
Q54: What is the <img src="https://d2lvgg3v3hfg70.cloudfront.net/TB10223/.jpg" alt="What is