Multiple Choice
The ages of a group of patients being treated at one hospital for osteoporosis are summarized in the frequency histogram below. Based on the histogram, is a large sample necessary to conduct a hypothesis test about the mean age? If so, why? 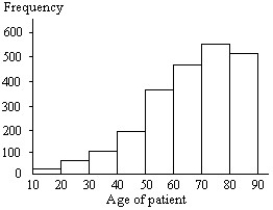
A) No; data appear to be normally distributed with no outliers.
B) Yes; data do not appear to be normally distributed but skewed left.
C) Yes; data do not appear to be normally distributed but bimodal.
D) Yes; data do not appear to be normally distributed but skewed right.
Correct Answer:

Verified
Correct Answer:
Verified
Q7: Find the test statistic <img src="https://d2lvgg3v3hfg70.cloudfront.net/TB10223/.jpg" alt="Find
Q8: Determine the test statistic, z, to test
Q9: A nationwide survey claimed that at least
Q10: The null and alternative hypotheses are given.
Q11: A relative frequency histogram for the sale
Q13: Use a t-test to test the claim
Q14: Use a t-test to test the claim
Q15: The dean of a major university claims
Q16: Use a t-test to test the claim
Q17: We never conclude "Accept <img src="https://d2lvgg3v3hfg70.cloudfront.net/TB10223/.jpg" alt="We