Multiple Choice
The weights (in ounces) of a sample of tomatoes of a particular variety are summarized in the boxplot below. Based on the boxplot, is a large sample necessary to conduct a hypothesis test about the mean weight? If so, why? 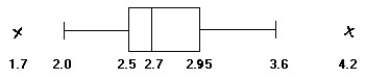
A) Yes; data do not appear to be normally distributed but skewed right.
B) Yes; data contain outliers.
C) Yes; data do not appear to be normally distributed but skewed left.
D) No; data appear to be normally distributed with no outliers.
Correct Answer:

Verified
Correct Answer:
Verified
Q1: Find the test statistic <img src="https://d2lvgg3v3hfg70.cloudfront.net/TB10223/.jpg" alt="Find
Q2: The null and alternative hypotheses are given.
Q4: If I specify ? to be equal
Q5: A method currently used by doctors to
Q6: In 2010, the mean expenditure for auto
Q7: Find the test statistic <img src="https://d2lvgg3v3hfg70.cloudfront.net/TB10223/.jpg" alt="Find
Q8: Determine the test statistic, z, to test
Q9: A nationwide survey claimed that at least
Q10: The null and alternative hypotheses are given.
Q11: A relative frequency histogram for the sale