Multiple Choice
Data from gapminder.org on 184 countries was used to examine if there is an association between (average) female life expectancy (that is, the average lifespan of women in the country) and the average number of children women give birth to for the year 2019. A scatterplot of the data follows. 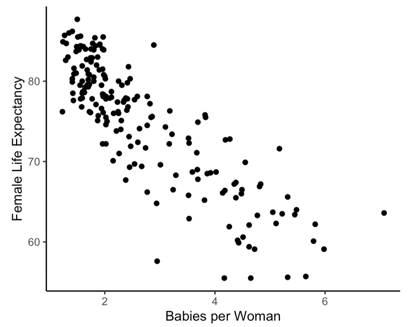
-State the null and alternative hypotheses using proper notation.
A)  versus
B)  versus
C)  versus
D)  versus
Correct Answer:

Verified
Correct Answer:
Verified
Q53: Which of the following correlation coefficient values
Q54: Are people with bigger brains more intelligent?
Q55: Annual measurements of the number of powerboat
Q56: Babies born with low birth weights (less
Q57: If the correlation coefficient between variables x
Q59: Data from gapminder.org on 184 countries was
Q60: Social warmth is a term referring to
Q61: The following scatterplot displays the finish time
Q62: Babies born with low birth weights (less
Q63: Social warmth is a term referring to