Multiple Choice
It is commonly expected that as a person ages, their muscle mass decreases. To further examine this relationship in women, a nutritionist randomly selected 60 female patients from her clinic, 15 women from each 10-year age group beginning with age 40 and ending with age 80. For each patient, her age and current muscle mass was recorded. A scatterplot, least squares regression line, and coefficient of determination are as follows. 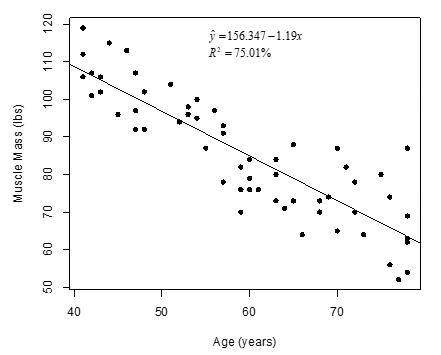
-Write a sentence interpreting the value of the slope in the context of the study.
A) A one year increase in age is associated with a 1.19 lb increase in predicted muscle mass.
B) A one year increase in age is associated with a 1.19 lb decrease in predicted muscle mass.
C) A one year increase in muscle mass is associated with a 1.19 lb increase in predicted age.
D) A one year increase in muscle mass is associated with a 1.19 lb decrease in predicted age.
Correct Answer:

Verified
Correct Answer:
Verified
Q35: Data from gapminder.org on 184 countries was
Q36: The following scatterplot displays the finish time
Q37: Data from gapminder.org on 184 countries was
Q38: A student in an AP Statistics class
Q39: Data from gapminder.org on 184 countries was
Q41: Social warmth is a term referring to
Q42: Observations with values of the explanatory variable
Q43: Annual measurements of the number of powerboat
Q44: Data from gapminder.org on 184 countries was
Q45: Babies born with low birth weights (less