Multiple Choice
The following plots display data exam scores for two different statistics classes. 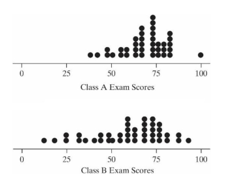
-What is the shape of the distribution of exam scores for Class B?
A) Symmetric
B) Bell-shaped
C) Skewed left
D) Skewed right
Correct Answer:

Verified
Correct Answer:
Verified
Related Questions
Q7: The plots below were created using a
Q8: Suppose you plan to roll a six-sided
Q9: Van Nood et al. (2013) studied patients
Q10: A meteorologist is hoping to find a
Q11: Which of the following sets of numbers
Q13: Which of the following variables are likely
Q14: A researcher designed a study to test
Q15: In June of 2012, New York City
Q16: The lottery game Powerball advertises that the
Q17: The plots below were created using a