Essay
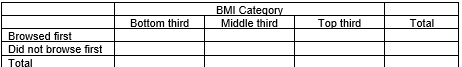
Researchers analyzed eating behavior and obesity at Chinese buffets. They estimated people's body mass indexes (BMI) as they entered the restaurant then categorized them into three groups---bottom third (lightest), middle third, and top third (heaviest). One variable they looked at was whether or not they browsed the buffet (looked it over) before serving themselves or served themselves immediately. Treating the BMI categories as the explanatory variable and whether or not they browsed first as the response, the researchers wanted to see if there was an association between BMI and whether or not they browsed the buffet before serving themselves. They found the following results:
• Bottom Third: 35 of the 50 people browsed first
• Middle Third: 24 of the 50 people browsed first
• Top Third: 17 of the 50 people browsed first
-Fill in the following two-way table with the observed data.
Correct Answer:

Verified
Tol for ea...View Answer
Unlock this answer now
Get Access to more Verified Answers free of charge
Correct Answer:
Verified
View Answer
Unlock this answer now
Get Access to more Verified Answers free of charge
Q35: Hope student researchers want to determine if
Q36: Suppose we conduct a chi-square goodness-of-fit test
Q37: Researchers analyzed eating behavior and obesity at
Q38: According to the 2019 U.S. Census Bureau
Q39: Hope student researchers want to determine if
Q41: Researchers analyzed eating behavior and obesity at
Q42: Are people equally likely to be born
Q43: Researchers analyzed eating behavior and obesity at
Q44: Hope student researchers want to determine if
Q45: What shape is the distribution of the