Multiple Choice
According to the 2019 U.S. Census Bureau estimates, 63.4% of the U.S. self-identifies as Non-Hispanic white, 15.3% as Hispanic and Latino, 13.4% as Black or African American, 5.9% as Asian, and 2.0% as Other. A random sample of 1000 students graduating from California colleges and universities resulted in the following data on self-identified race: 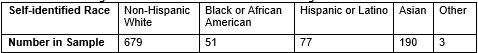 You would like to determine if the distribution of self-identified race among California college and university students differs from the distribution of self-identified race in the U.S. overall.
-In the null hypothesis, what does the symbol ?_Race represent?
A) The proportion of the U.S. that self-identify as a certain Race
B) The proportion of Californians that self-identify as a certain Race
C) The proportion of all students graduating from California colleges and universities that self-identify as a certain Race
D) The proportion of the sample of 1000 students that self-identified as a certain Race
Correct Answer:

Verified
Correct Answer:
Verified
Q11: Can telling a joke affect whether or
Q12: Is there an association between a person's
Q13: The chi-square statistic is the ratio of
Q14: Can telling a joke affect whether or
Q15: Which of the following is not one
Q17: According to the 2019 U.S. Census Bureau
Q18: According to the 2019 U.S. Census Bureau
Q19: The Mean Group Diff statistic is the
Q20: Can telling a joke affect whether or
Q21: Are people equally likely to be born