Multiple Choice
According to the 2019 U.S. Census Bureau estimates, 63.4% of the U.S. self-identifies as Non-Hispanic white, 15.3% as Hispanic and Latino, 13.4% as Black or African American, 5.9% as Asian, and 2.0% as Other. A random sample of 1000 students graduating from California colleges and universities resulted in the following data on self-identified race: 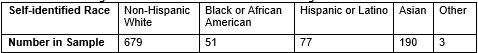 You would like to determine if the distribution of self-identified race among California college and university students differs from the distribution of self-identified race in the U.S. overall.
-Are the validity conditions met for a theory-based chi-square goodness-of-fit test?
A) Yes, since 1000 is larger than 20.
B) Yes, since all of the expected counts are at least 10.
C) No, since the observed count for Other is less than 10.
D) Yes, since the p-values from both the simulation-based and theory-based tests are similar.
Correct Answer:

Verified
Correct Answer:
Verified
Q21: Are people equally likely to be born
Q22: As the chi-square statistic increases, the p-value
Q23: Researchers analyzed eating behavior and obesity at
Q24: Are people equally likely to be born
Q25: According to the 2019 U.S. Census Bureau
Q27: Why do we do overall tests when
Q28: Are people equally likely to be born
Q29: Hope student researchers want to determine if
Q30: Is there an association between a person's
Q31: Researchers analyzed eating behavior and obesity at