Multiple Choice
A past statistics project investigated how well college students perceive their own attractiveness. Twenty college students were recruited to participate in the study. As part of the study, each student rated their own attractiveness on a scale from 1 - 10. Each of the 20 participants also agreed to have their picture taken. All pictures were taken in similar lighting. In the second part of the study, a group of 79 college student volunteers (who were not part of the original group of 20) agreed to rate the attractiveness of each of the people in the pictures on a scale of 1 - 10. Researchers then averaged the attractiveness rating of the 79 "raters" (referred to as the societal rating) to compare to the self-rating to determine whether or not college students are accurate in their self-perceptions. Summary statistics are presented in the following table. 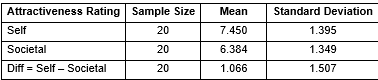
-Write the null and alternative hypothesis using proper notation.
A)  versus
  where d is the difference Self - Societal
B)  versus
  where d is the difference Self - Societal
C) 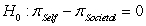 versus
D) 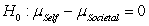 versus
Correct Answer:

Verified
Correct Answer:
Verified
Q34: Researchers randomly selected 36 children who had
Q35: The following summary statistics and two dotplots
Q36: The following summary statistics and two dotplots
Q37: Researchers are interested in investigating the effect
Q38: A past statistics project investigated how well
Q40: Patients with chronic obstruction pulmonary disease (COPD)
Q41: Researchers randomly selected 36 children who had
Q42: Researchers are interested in investigating the effect
Q43: A past statistics project investigated how well
Q44: A past statistics project investigated how well