Multiple Choice
The following histogram shows the distribution of the difference between the actual and "ideal" weights for 119 female students. Ideal weights are responses to the question "What is your ideal weight"? The difference = actual - ideal. 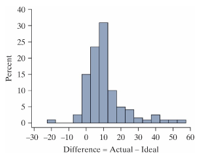
-The median of the distribution is approximately___
A) -10 pounds.
B) 10 pounds.
C) 30 pounds.
D) 50 pounds.
Correct Answer:

Verified
Correct Answer:
Verified
Q33: For a survey on affirmative action, researchers
Q34: Most experts recommend college students get at
Q35: Adult male polar bears are expected to
Q36: Most experts recommend college students get at
Q37: A hot dog manufacturer asserts that one
Q39: If your p-value is very small, you
Q40: If a distribution is skewed left, then
Q41: If your p-value is very large, your
Q42: Adult male polar bears are expected to
Q43: The following 19 test scores are based