Multiple Choice
The following histogram shows the distribution of the difference between the actual and "ideal" weights for 119 female students. Ideal weights are responses to the question "What is your ideal weight"? The difference = actual - ideal. 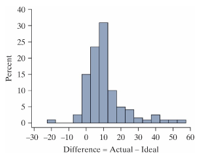
-How does the mean compare to the median in this data set?
A) The mean is larger than the median.
B) The median is larger than the mean.
C) The median and mean are approximately equal.
D) We are unable to compare the mean and the median without calculations.
Correct Answer:

Verified
Correct Answer:
Verified
Q10: A hot dog manufacturer asserts that one
Q11: In June of 2012, New York City
Q12: Noxious weeds are invasive plants that quickly
Q13: A rental car company has noticed that
Q14: A histogram of a bootstrapped null distribution
Q16: A rental car company has noticed that
Q17: If the sample size is larger than
Q18: Most experts recommend college students get at
Q19: Noxious weeds are invasive plants that quickly
Q20: Suppose that the proportion of all American