Multiple Choice
The following histogram shows the distribution of the difference between the actual and "ideal" weights for 119 female students. Ideal weights are responses to the question "What is your ideal weight"? The difference = actual - ideal. 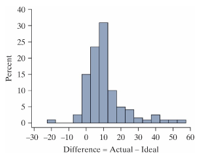
-If the observation at -20 pounds was removed from the data set, the mean would___
A) increase.
B) decrease.
C) remain the same.
Correct Answer:

Verified
Correct Answer:
Verified
Q20: Suppose that the proportion of all American
Q21: The following histogram shows the distribution of
Q22: The following 19 test scores are based
Q23: A rental car company has noticed that
Q24: Suppose that the proportion of all
Q26: Suppose that the proportion of all American
Q27: Adult male polar bears are expected to
Q28: Most experts recommend college students get at
Q29: Suppose that the proportion of all American
Q30: Most experts recommend college students get at