Short Answer
The following table represents the amount of monthly data handled by MichNet, the University of Michigan's gateway to the Internet, sampled at six month intervals for the years 1993-1995. (The data is from the Michigan Daily, March 30, 1996, p.4.)
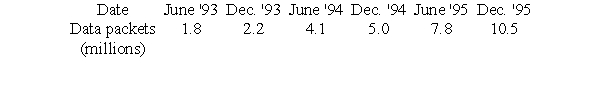
Let d be the number of data packets handled monthly (in billions), and t be time in years since December, 1992. Find equations for the best fit exponential function and the best fit power function that model these data (you do not have to enter your equations). By comparing their correlation coefficients, choose which model gives a better fit.
A) The exponential model
B) The power function model
Correct Answer:

Verified
Correct Answer:
Verified
Q114: The graphs of <img src="https://d2lvgg3v3hfg70.cloudfront.net/TB10073/.jpg" alt="The
Q115: Which of the following are possible formulas
Q116: A right circular cylinder has a volume
Q117: <img src="https://d2lvgg3v3hfg70.cloudfront.net/TB10073/.jpg" alt=" A)
Q118: <img src="https://d2lvgg3v3hfg70.cloudfront.net/TB10073/.jpg" alt=" " class="answers-bank-image d-block" rel="preload"
Q120: Find the long-run behavior of the function
Q121: The volume of pollutants (in millions of
Q122: George measures the force exerted by a
Q123: The power function through the point (1,
Q124: Let <img src="https://d2lvgg3v3hfg70.cloudfront.net/TB10073/.jpg" alt="Let .