Short Answer
The following table represents the amount of monthly data handled by MichNet, the University of Michigan's gateway to the Internet, sampled at six month intervals for the years 1993-1995. (The data is from the Michigan Daily, March 30, 1996, p.4.) The article also stated that the data handling capacity of the MichNet system was about 40 billion data packets per month.
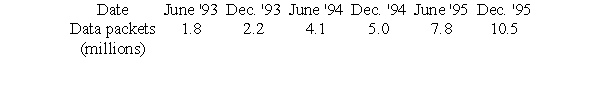
Let d be the number of data packets handled monthly (in billions), and t be time in years since December, 1992. Find an equation for the best fit exponential function that models these data (you do not have to enter your equation). Use this equation to determine in what year the network became overloaded.
Correct Answer:

Verified
Correct Answer:
Verified
Q81: The following table contains the names of
Q82: The squirrel population in a certain area
Q83: Which of the following statements describe the
Q84: Suppose that <img src="https://d2lvgg3v3hfg70.cloudfront.net/TB10073/.jpg" alt="Suppose that
Q85: Let <img src="https://d2lvgg3v3hfg70.cloudfront.net/TB10073/.jpg" alt="Let
Q87: Use a graphing calculator or computer to
Q88: Perform the operations and then express the
Q89: <img src="https://d2lvgg3v3hfg70.cloudfront.net/TB10073/.jpg" alt=" " class="answers-bank-image d-block" rel="preload"
Q90: The graph of <img src="https://d2lvgg3v3hfg70.cloudfront.net/TB10073/.jpg" alt="The graph
Q91: Which of the following statements are true