Multiple Choice
Which of the following figures shows the graph of  ?
?
A) 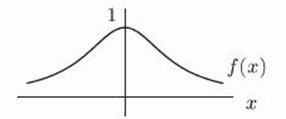
B) 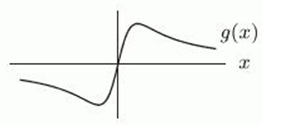
C) 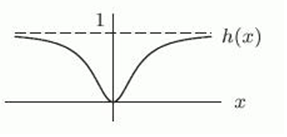
Correct Answer:

Verified
Correct Answer:
Verified
Q60: Let <img src="https://d2lvgg3v3hfg70.cloudfront.net/TB10073/.jpg" alt="Let .
Q61: Is <img src="https://d2lvgg3v3hfg70.cloudfront.net/TB10073/.jpg" alt="Is
Q62: Which of the following functions dominates as
Q63: <img src="https://d2lvgg3v3hfg70.cloudfront.net/TB10073/.jpg" alt=" A)
Q64: The squirrel population in a certain area
Q66: Let <img src="https://d2lvgg3v3hfg70.cloudfront.net/TB10073/.jpg" alt="Let .
Q67: The formula for the function graphed below
Q68: Does <img src="https://d2lvgg3v3hfg70.cloudfront.net/TB10073/.jpg" alt="Does have
Q69: George measures the force exerted by a
Q70: Compute the following limits:<br>a) <img src="https://d2lvgg3v3hfg70.cloudfront.net/TB10073/.jpg"