Short Answer
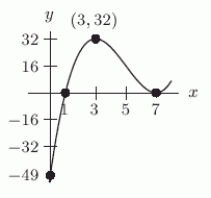
Let 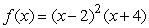 . The following figure shows the graph of
  , with a = _____.
Correct Answer:

Verified
Correct Answer:
Verified
Related Questions
Q15: The following figure gives the graphs of
Q16: Which of the following statements are true
Q17: It is possible for a rational function
Q18: Which of the following formulas has a
Q19: Which of the following could be a
Q21: Compute the following limits:<br>a) <img src="https://d2lvgg3v3hfg70.cloudfront.net/TB10073/.jpg" alt="Compute
Q22: Given the following graph, what would the
Q23: Poiseuille's law says that the rate at
Q24: Which of the following graphs show p
Q25: Which of the following are rational functions:<br>A)