Short Answer
The following figure shows the graphs of  and
and  . What is the value of A?
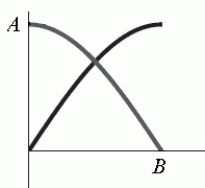
Correct Answer:

Verified
Correct Answer:
Verified
Q62: How many solutions to <img src="https://d2lvgg3v3hfg70.cloudfront.net/TB10073/.jpg"
Q63: Simplify <img src="https://d2lvgg3v3hfg70.cloudfront.net/TB10073/.jpg" alt="Simplify (for
Q64: Find a solution in the interval
Q65: What are the polar inequalities that describe
Q66: A wheel has radius 6 inches and
Q68: What is the equation in polar coordinates
Q69: What is <img src="https://d2lvgg3v3hfg70.cloudfront.net/TB10073/.jpg" alt="What is
Q70: Simplify <img src="https://d2lvgg3v3hfg70.cloudfront.net/TB10073/.jpg" alt="Simplify (For
Q71: <img src="https://d2lvgg3v3hfg70.cloudfront.net/TB10073/.jpg" alt=" " class="answers-bank-image d-block" rel="preload"
Q72: Let P be a point on the