Multiple Choice
Educational psychologists suggest that a child's intellectual capacity, I, can be represented as a function of time, t, in months, as follows: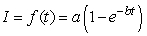 ,Where a > 0, b > 0 are constants. What is the effect on the graph of I of decreasing the value of b?
A) The graph gets closer to the asymptote more quickly.
B) The asymptote moves to the left.
C) The asymptote moves down.
D) The graph gets closer to the asymptote less quickly.
Correct Answer:

Verified
Correct Answer:
Verified
Q90: The graph of <img src="https://d2lvgg3v3hfg70.cloudfront.net/TB10073/.jpg" alt="The
Q91: Let <img src="https://d2lvgg3v3hfg70.cloudfront.net/TB10073/.jpg" alt="Let be
Q92: The graph of <img src="https://d2lvgg3v3hfg70.cloudfront.net/TB10073/.jpg" alt="The
Q93: If <img src="https://d2lvgg3v3hfg70.cloudfront.net/TB10073/.jpg" alt="If
Q94: For a given function <img src="https://d2lvgg3v3hfg70.cloudfront.net/TB10073/.jpg"
Q95: How are the graphs of <img src="https://d2lvgg3v3hfg70.cloudfront.net/TB10073/.jpg"
Q96: Find the domain and range of <img
Q97: The following figure shows the graph of
Q98: Let <img src="https://d2lvgg3v3hfg70.cloudfront.net/TB10073/.jpg" alt="Let represent
Q100: The graphs of <img src="https://d2lvgg3v3hfg70.cloudfront.net/TB10073/.jpg" alt="The graphs