Multiple Choice
Find the domain and range of  if
if Represents the number of hours it takes a farmer to plant a square field with side length x (in thousands of feet) .
A) 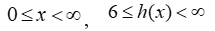
B) 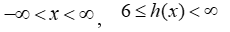
C) 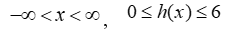
D) 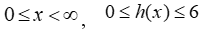
E) 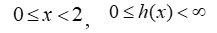
Correct Answer:

Verified
Correct Answer:
Verified
Related Questions
Q5: The amount of money in your bank
Q6: Let<img src="https://d2lvgg3v3hfg70.cloudfront.net/TB10073/.jpg" alt="Let and for
Q7: The following table gives some values for
Q8: Below is a graph of the function
Q9: The point (a, b) lies on the
Q11: Below is a graph of the function
Q12: Let 4 and -4 be the zeros
Q13: The following table gives values for <img
Q14: The average rate of change of <img
Q15: Graph <img src="https://d2lvgg3v3hfg70.cloudfront.net/TB10073/.jpg" alt="Graph