Short Answer
The table below gives the number of ants living in a museum display. Use linear regression on the values t and 
to fit a function of the form

.
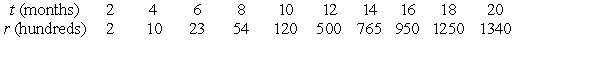 Use a calculator program to find the regression line for this data. Use the regression line to calculate the number of ants after 22 months. Give your answer to the nearest whole number.
Correct Answer:

Verified
Correct Answer:
Verified
Q2: Sound A is 31 dB. Sound B
Q3: Use linear regression on the values x
Q4: Suppose the population of an endangered species
Q5: Find <br> <img src="https://d2lvgg3v3hfg70.cloudfront.net/TB10073/.jpg" alt="Find
Q6: The following table gives z as a
Q8: Evaluate <img src="https://d2lvgg3v3hfg70.cloudfront.net/TB10073/.jpg" alt="Evaluate
Q9: Solve for t: <img src="https://d2lvgg3v3hfg70.cloudfront.net/TB10073/.jpg" alt="Solve
Q10: Let <img src="https://d2lvgg3v3hfg70.cloudfront.net/TB10073/.jpg" alt="Let .
Q11: A town with an initial population of
Q12: Rewriting the statement log y = x