Short Answer
The following figure shows the graphs of
(A).

(B).

(C).

(D).

.
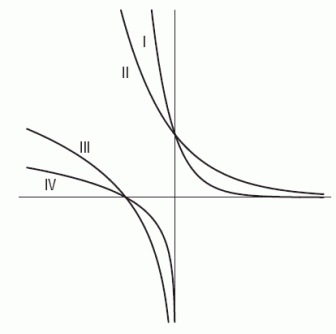 Which one is the graph of C?
Correct Answer:

Verified
Correct Answer:
Verified
Related Questions
Q49: A small country is experiencing hyperinflation of
Q50: Consider the function <img src="https://d2lvgg3v3hfg70.cloudfront.net/TB10073/.jpg" alt="Consider the
Q51: The following table gives v as a
Q52: What is the domain of the function
Q53: Solve <img src="https://d2lvgg3v3hfg70.cloudfront.net/TB10073/.jpg" alt="Solve
Q55: What annual interest rate, compounded monthly, is
Q56: By what order of magnitude do the
Q57: How many times more powerful is an
Q58: The hydrogen ion concentration [H<sup>+</sup>] for a
Q59: You invest $5000 in an account earning