Multiple Choice
The graph of the exponential function  Is shown below. Suppose
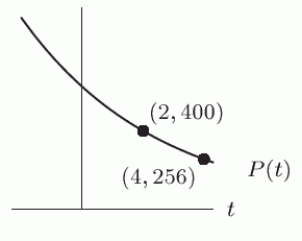
  Represents a city's population, in thousands, t years after 1995. Which of the following quantities are equivalent?
A) 
B) Approximately -295 thousand
C) Approximately 705 thousand
D) The change in the city's population between 1996 and 2000
E) 
F) The rate at which the population is declining between 1996 and 2000
Correct Answer:

Verified
Correct Answer:
Verified
Q17: The formula for the exponential function f
Q18: The number of books in a library
Q19: If you start with $2000, how much
Q20: A biologist measures the amount of contaminant
Q21: Consider the following figure, where Graph I
Q23: Kathleen opens a savings account with $1200.
Q24: Let <img src="https://d2lvgg3v3hfg70.cloudfront.net/TB10073/.jpg" alt="Let
Q25: The US population in 2005 was approximately
Q26: Which of the graphs in the following
Q27: In the exponential formula <br> <img src="https://d2lvgg3v3hfg70.cloudfront.net/TB10073/.jpg"