Short Answer
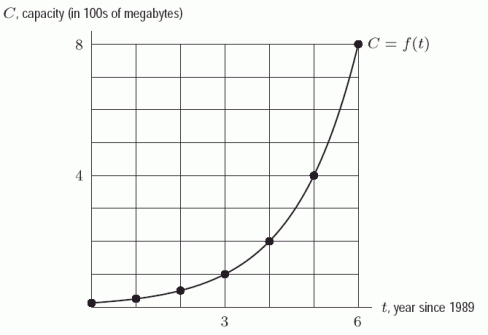
The following figure gives the graph of  , where C is the computer hard disk capacity (in hundreds of megabytes) that could be bought for $500 t years past 1989. If the trend displayed in the graph continued, how many megabytes would a $500 hard drive have in 1999? Round to the nearest hundred.
Correct Answer:

Verified
Correct Answer:
Verified
Q89: The populations of 4 species of animals
Q90: The figure below shows the graphs of
Q91: How much interest is earned in an
Q92: <img src="https://d2lvgg3v3hfg70.cloudfront.net/TB10073/.jpg" alt=" ?" class="answers-bank-image d-block"
Q93: The following figure shows two functions, one
Q95: Is the formula for a function representing
Q96: Jeff has $<sup>20,000.</sup>He placed $10,000 in Bank
Q97: Write a verbal description for each of
Q98: A quantity increased from 20 to 24.
Q99: An investment grows according to the formula